How Much Does a Truck Driver Make? Salary Guide by State and Experience
Where the real numbers live: which BLS tables to open, how percentile bands map to experience, and which parts of a driver's check are not base pay.
By Harlan Voss · Oct 06, 2026 · 11 min read
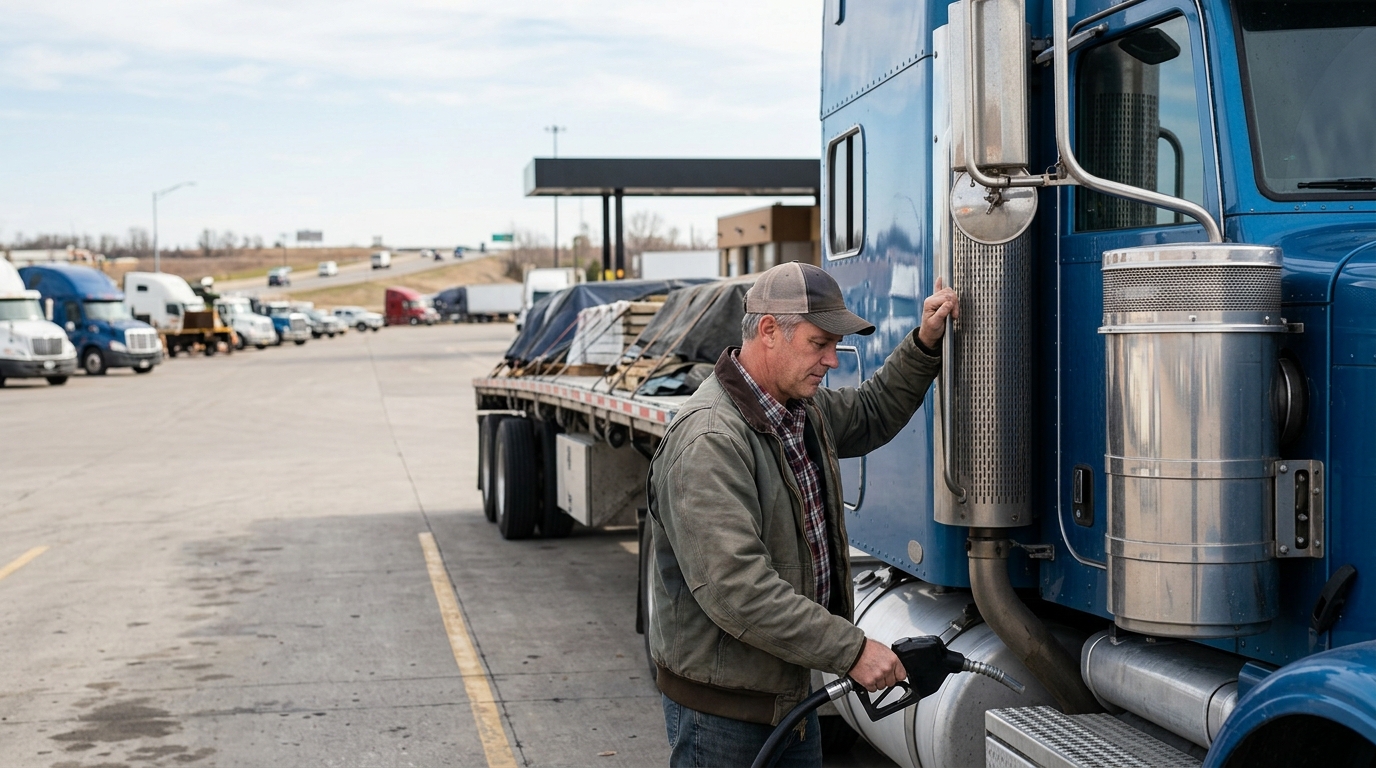
Truck driver pay is published by the U.S. Bureau of Labor Statistics in two places: the Occupational Outlook Handbook, which gives a median annual and hourly wage for heavy and tractor-trailer truck drivers (U.S. Bureau of Labor Statistics, 2025), and the Occupational Employment and Wage Statistics (OEWS) tables, which break the same occupation into 10th, 25th, 50th, 75th and 90th percentile wages and into metro-area and industry means for May 2023 (U.S. Bureau of Labor Statistics, 2023).
This guide tells you which figure to read, what unit it is in, and what moves a driver from the bottom of that distribution to the top. Because OEWS is re-released every year, look up the live dollar values in the tables named below rather than trusting a number copied onto any page, including this one.
What Truck Drivers Earn
The headline number for this job is the median pay for heavy and tractor-trailer truck drivers published by the U.S. Bureau of Labor Statistics (2025) in the Occupational Outlook Handbook. BLS gives it as both an annual and an hourly median, and the two are the same figure expressed differently — a median means half of drivers earned more and half earned less, so it is not an average and it is not a starting wage. Open the Occupational Outlook Handbook entry for heavy and tractor-trailer truck drivers and read the "Median pay" line, noting the year stamped on it.
The median alone will mislead you. The fuller picture is in the BLS Occupational Employment and Wage Statistics (OEWS) tables for May 2023, which publish five points on the same distribution for this occupation: the 10th percentile wage, the 25th percentile wage, the median (50th percentile) wage, the 75th percentile wage and the 90th percentile wage (U.S. Bureau of Labor Statistics, 2023). The 10th percentile is roughly where a first-year driver at a large entry-level carrier sits; the 90th percentile is roughly where experienced drivers in specialised freight, union fleets or high-paying metros sit. Read those two endpoints together, in the same unit — OEWS gives both hourly and annual columns, so compare hourly to hourly or annual to annual, never one against the other.
OEWS also publishes a mean (average) wage for the occupation for May 2023 (U.S. Bureau of Labor Statistics, 2023). The mean sits above the median for this job because the top of the distribution stretches further than the bottom. If a recruiter quotes you an "average," ask whether it is the mean or the median, and whether it includes mileage bonuses and accessorial pay or just base.
One more thing the tables do not show: BLS wage data covers employed wage-and-salary drivers. Owner-operators are not in it. If you are comparing a company driving job to leasing your own truck, you are comparing a wage to gross business revenue, and those are not matched units.
For context on demand rather than pay, BLS publishes the current number of jobs held by heavy and tractor-trailer truck drivers, the projected employment change for 2025-35, and the average number of annual job openings projected over that decade (U.S. Bureau of Labor Statistics, 2025).
Pay by Experience Level
BLS does not publish wages by years of experience for this occupation. What it does publish is the percentile distribution, so the honest way to read experience into the data is to map typical career stages onto the OEWS percentile bands for May 2023 and look up the dollar value of each band yourself.
| Stage | Typical years driving | Where to read the figure (BLS OEWS, May 2023) |
|---|---|---|
| First-seat / company-trained | 0-1 | 10th percentile wage, annual or hourly |
| Established solo driver | 1-3 | 25th percentile wage, annual or hourly |
| Experienced OTR or regional | 3-7 | Median (50th percentile) wage, annual or hourly |
| Senior, specialised or dedicated | 7-15 | 75th percentile wage, annual or hourly |
| Top of the market | 10+ | 90th percentile wage, annual or hourly |
Two cautions. First, these bands are a reading of the distribution, not a BLS statement that a driver with five years earns the median. A three-year driver in a union LTL fleet can sit above a fifteen-year driver at a low-cost-per-mile carrier. Second, the percentile figures are wages — base mileage or hourly pay plus the earnings BLS counts. Sign-on bonuses, per diem reimbursements and quarterly safety bonuses are total compensation, not base, and they stop when you stop qualifying for them.
Pay by State or Metro Area
The OEWS tables publish an annual mean wage for heavy and tractor-trailer truck drivers for each metro area, for May 2023 (U.S. Bureau of Labor Statistics, 2023). Below are six large-employment metros. New York-Newark-Jersey City is listed first because BLS identifies it as the highest-paying of the metro areas with the highest employment levels in this occupation (May 2023); the remaining five are listed alphabetically, because their relative order changes between data years and you should rank them from the live table rather than from memory.
| Metro area | Figure to look up | Source |
|---|---|---|
| New York-Newark-Jersey City, NY-NJ-PA (highest-paying of the high-employment metros) | Annual mean wage | BLS OEWS, May 2023 |
| Atlanta-Sandy Springs-Roswell, GA | Annual mean wage | BLS OEWS, May 2023 |
| Chicago-Naperville-Elgin, IL-IN-WI | Annual mean wage | BLS OEWS, May 2023 |
| Dallas-Fort Worth-Arlington, TX | Annual mean wage | BLS OEWS, May 2023 |
| Philadelphia-Camden-Wilmington, PA-NJ-DE-MD | Annual mean wage | BLS OEWS, May 2023 |
| Riverside-San Bernardino-Ontario, CA | Annual mean wage | BLS OEWS, May 2023 |
All six rows are annual means, so they can be compared directly against each other and against the national annual mean for May 2023 — but not against the national median, which is a different measure. OEWS also publishes state-level annual mean wages for all 50 states and D.C.; if you are weighing a move, pull the state figures for both states in the same data year and in the same unit, then set them against housing and state income tax, which differ by state and change the value of an identical gross wage.
Factors That Affect Pay
- Industry. Truck Transportation employs the largest share of these drivers and has its own annual mean wage in the OEWS tables for May 2023; Motion Picture and Video Industries is the top-paying industry for the occupation in the same year (U.S. Bureau of Labor Statistics, 2023). Compare those two annual means side by side to see how large the industry effect is — it is the single biggest lever in the dataset after geography.
- Metro area. The annual mean wage differs between the six metros in the table above, with New York-Newark-Jersey City the highest-paying of the high-employment metros (BLS OEWS, May 2023). Subtract the lowest from the highest in the live table to size the gap in dollars per year.
- Pay structure. Cents-per-mile pay rises and falls with miles dispatched; hourly pay does not. Local and dedicated work is more often hourly, over-the-road more often per mile. Ask for the pay packet in writing and ask whether overtime is paid, because that determines whether a quoted weekly figure is base or base plus overtime.
- Endorsements and freight type. Hazmat, tanker, doubles/triples and oversize-load work raise the rate per mile or per hour above a carrier's general freight rate at most fleets, because fewer drivers qualify. The direction is up; the size is set by the individual carrier's pay scale, not by any national table.
- Union status. Where a fleet is covered by a collective agreement, wages follow a published scale with defined progression steps rather than individual negotiation. Ask to see the scale and the step you would start on.
- Employer type. Private fleets (a retailer or manufacturer hauling its own freight) and for-hire carriers pay differently for the same CDL, and owner-operators receive gross revenue out of which fuel, insurance, maintenance and the truck payment come. Never compare an owner-operator's gross to a company driver's wage.
- Accessorial and bonus pay. Detention, stop-off, layover, tarping and safety bonuses are total compensation on top of base. They can be a meaningful share of a check, and they are the first thing to disappear in a slow freight market.
How to Increase Your Pay in This Role
- Add a hazmat and tanker endorsement to your Class A CDL. Both require a knowledge test and, for hazmat, a background check, and both open freight that general-freight-only drivers cannot take. Ask each carrier what its endorsed rate is before you test, so you know the increase in cents per mile or dollars per hour you are buying.
- Move from entry-level OTR to a dedicated account or private fleet after your first year. The common pattern is: get hired by a carrier that trains and hires at the 10th-percentile end of the BLS OEWS May 2023 distribution, build twelve months of verifiable safe miles, then take that record to a dedicated or private fleet that requires experience. The experience requirement is the mechanism — it restricts supply, and the pay reflects it.
- Negotiate accessorials, not just the mileage rate. Ask for detention pay starting at the first hour rather than the second, stop pay on every stop after the first, and layover pay in writing. On a multi-stop account these can move the annual total more than a one-cent bump in the mileage rate.
- Ask for the carrier's written pay progression schedule at interview. Many fleets have automatic increases at fixed mileage or tenure milestones. Getting the schedule in writing lets you ask for a review at the milestone instead of waiting to be offered one.
- Check the OEWS annual mean for your metro before you pick a domicile. Drivers at the same carrier can be paid on different scales by terminal. Pull the May 2023 annual mean for both metros (U.S. Bureau of Labor Statistics, 2023) and compare them in the same unit before you request a transfer.
- Before going owner-operator, build a cost-per-mile sheet. Put fuel, insurance, maintenance, tyres, the truck payment and downtime against the gross rate. If the net does not clear the company-driver wage you would give up, the move is a pay cut with more risk attached.
Frequently asked questions
Is the BLS median the same as a starting wage?
No. The median is the 50th percentile — half of heavy and tractor-trailer truck drivers earned more and half earned less (U.S. Bureau of Labor Statistics, 2025). A first-year driver is more likely to be near the 10th or 25th percentile wage in the OEWS tables for May 2023 (U.S. Bureau of Labor Statistics, 2023).
Which industry pays truck drivers the most?
BLS names Motion Picture and Video Industries as the top-paying industry for heavy and tractor-trailer truck drivers in May 2023 (U.S. Bureau of Labor Statistics, 2023). It is a small employer. Truck Transportation employs the largest share of drivers and has its own, lower annual mean wage in the same May 2023 release.
Which big metro pays the most?
Among the metro areas with the highest employment levels in this occupation, BLS lists New York-Newark-Jersey City, NY-NJ-PA as the highest-paying by annual mean wage for May 2023 (U.S. Bureau of Labor Statistics, 2023). Compare it against Chicago, Philadelphia, Riverside, Dallas-Fort Worth and Atlanta in the same table and the same unit.
How much schooling do I need before I can earn a driver's wage?
BLS publishes a typical entry-level education level and a typical on-the-job training period for heavy and tractor-trailer truck drivers in the Occupational Outlook Handbook (U.S. Bureau of Labor Statistics, 2025). Check those two lines for the current entries. Licensing itself — CDL class, endorsements, testing — is set by your state's licensing agency, so confirm the requirements with that agency rather than a school's advertising.
Is hiring likely to hold up over the next few years?
BLS publishes a projected employment change for this occupation for 2025-35 and an average number of job openings projected each year over that decade (U.S. Bureau of Labor Statistics, 2025). Openings include replacements for drivers who retire or leave the occupation, not just new positions, which is why the openings number is usually much larger than the growth number. No data point guarantees any individual a job offer.
Should I count a sign-on bonus as part of my salary?
Treat it as total compensation, not base. Sign-on bonuses, per diem reimbursements, quarterly safety bonuses, detention and stop pay are all conditional and can stop. The wage figures in the BLS OEWS May 2023 tables are wages (U.S. Bureau of Labor Statistics, 2023) — compare a job offer's base mileage or hourly rate against them, and track the bonuses separately.
Sources
- U.S. Bureau of Labor Statistics — Heavy and Tractor-Trailer Truck Drivers : Occupational Outlook Handbook (2025)
- U.S. Bureau of Labor Statistics — Occupational Employment and Wage Statistics: Heavy and Tractor-Trailer Truck Drivers (53-3032) (2023)

Written by
Harlan Voss
Harlan covers the business of job-seeking itself — the coaches, platforms, and advice industries that have grown up around finding work. He writes with a skeptic's patience and a soft spot for anyone still trying.