Electrician vs. Plumber Salary: Full Pay Comparison
Two apprenticeship trades whose federal median wages sit less than $700 apart — here is where the numbers actually separate, at the bottom, the top and in government work.
By Harlan Voss · Oct 06, 2026 · 8 min read
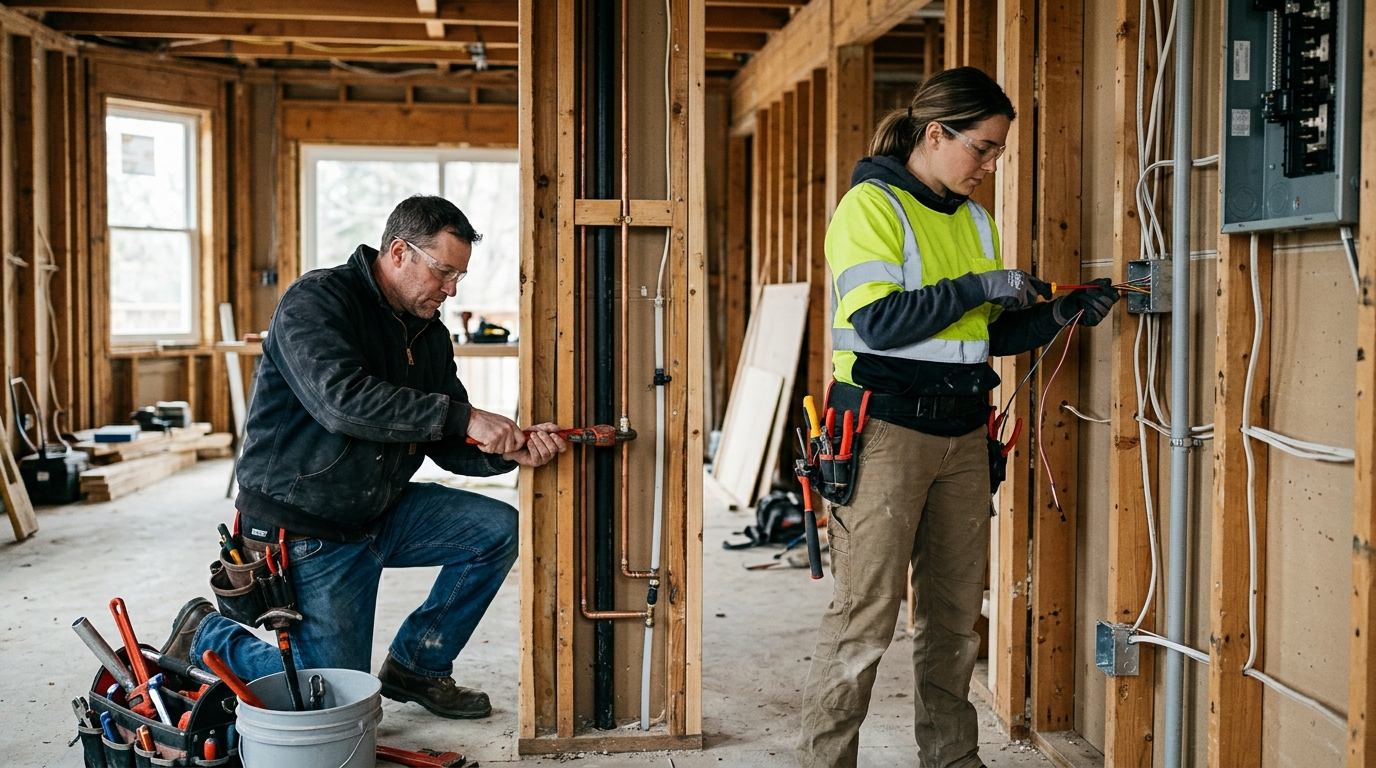
On the headline number, these two trades are nearly tied. The median annual wage for electricians was $63,190 in May 2025 and the median annual wage for plumbers, pipefitters and steamfitters was $63,800 in the same month (U.S. Bureau of Labor Statistics, 2025-05) — a difference of $610 a year in plumbers' favour, or just under 1 percent.
The interesting differences sit away from the middle: at the 10th percentile, at the 90th percentile, and in particular industries such as government work, where the two trades pull $8,160 a year apart. All figures below are annual wages from the same BLS release so the comparison is arithmetically valid; none of them are hourly, and none include overtime broken out separately.
Side-by-Side Pay Comparison
Every figure in this table is an annual wage from the U.S. Bureau of Labor Statistics Occupational Employment and Wage Statistics release for May 2025, except the training and employment rows, which come from the BLS Occupational Outlook Handbook (2025). Medians and percentiles are labelled as such — a median is the midpoint, not an average, and half of all workers in each trade earn less than it.
| Dimension | Electrician | Plumber, pipefitter, steamfitter | Difference |
|---|---|---|---|
| Median annual wage, May 2025 | $63,190 | $63,800 | $610 for plumbers |
| Entry-level proxy: 10th percentile annual wage, May 2025 | under $42,640 | under $44,150 | $1,510 for plumbers |
| Top end: 90th percentile annual wage, May 2025 | over $108,510 | over $108,420 | $90 for electricians |
| Highest-paying top industry median (government, excl. state and local education and hospitals), May 2025 | $79,820 | $71,660 | $8,160 for electricians |
| Typical raise timeline: apprenticeship to journey level | 4 or 5 years, about 2,000 hours paid on-the-job training a year | 4 or 5 years, about 2,000 hours paid on-the-job training a year | 0 years |
| Projected employment growth, 2025–2035 | 9 percent | 7 percent | 2 percentage points for electricians |
| Projected annual job openings, 2025–2035 average | 72,700 | 42,000 | 30,700 for electricians |
| Jobs held, 2025 | 821,000 | 510,600 | 310,400 for electricians |
Two things to hold on to. First, the $610 median gap and the $90 gap at the 90th percentile are small enough that your employer, state and industry will matter more than your trade. Second, these are wage figures, not total compensation: overtime, shift differentials, call-out premiums, per diem on travel jobs and any profit share sit on top of or inside your base depending on how your employer structures pay, and BLS does not publish them as separate line items. Ask any prospective employer what the base hourly rate is before overtime, then ask how many overtime hours were actually worked last year.
For the raise timeline, both trades follow the same ladder: apprentices are paid a percentage of the journey-level rate that steps up with hours completed, so your increases are tied to logged hours rather than annual reviews. After an apprenticeship, electricians are considered journey workers and may work on their own subject to state or local licensing (U.S. Bureau of Labor Statistics, 2025); plumbers complete the apprenticeship and pass a licensing exam to reach journey level, and can later move to master plumber, supervisor or project manager (U.S. Bureau of Labor Statistics, 2025).
Pay by Experience and Location
The rows below pair the two trades at the same point on the distribution so the numbers sit next to each other. All are annual wages for May 2025 from the U.S. Bureau of Labor Statistics. Percentiles are a reasonable stand-in for experience because, in both trades, apprentices cluster near the bottom and licensed journey workers with overtime cluster near the top — but they are percentiles, not verified experience bands.
| Tier | Electrician (annual) | Plumber, pipefitter, steamfitter (annual) | Who leads |
|---|---|---|---|
| Lowest 10 percent (apprentice / first years) | under $42,640 | under $44,150 | Plumbers by $1,510 |
| Median, all workers | $63,190 | $63,800 | Plumbers by $610 |
| Highest 10 percent (experienced, licensed, often heavy overtime) | over $108,510 | over $108,420 | Electricians by $90 |
| Government employers, excl. state and local education and hospitals (median) | $79,820 | $71,660 | Electricians by $8,160 |
On location: BLS publishes the same median and percentile wages by state and by metropolitan area in the Occupational Employment and Wage Statistics tables, and the spread between states is wide enough that a state-level check is worth more to you than any national median. Look up both occupation codes for your own state on the BLS OEWS pages, and compare your local cost of living at the same time — a higher state median does not automatically mean more money left at the end of the month.
Also check the data year every time. The figures here are May 2025; BLS refreshes OEWS annually, so a number you find quoted elsewhere without a month and year attached is not usable.
Why the Pay Gap Exists
The gaps are small at the median and large in specific pockets, and the reasons are structural rather than mysterious.
Licensing works differently at the entry gate. Most states require electricians to pass a test and hold a licence, and requirements vary by state (U.S. Bureau of Labor Statistics, 2025). For plumbers, most states and some localities require a licence (U.S. Bureau of Labor Statistics, 2025), and BLS describes passing a required licensing exam as part of reaching journey level (U.S. Bureau of Labor Statistics, 2025). That extra layer of local-level gatekeeping restricts the supply of legally working plumbers in some cities, which is consistent with plumbers' 10th percentile sitting $1,510 a year above electricians' at $44,150 versus $42,640 (May 2025).
Training length is not a reason. Both trades typically start from a high school diploma or equivalent and both learn through a 4- or 5-year apprenticeship of roughly 2,000 hours of paid on-the-job training a year plus technical instruction (U.S. Bureau of Labor Statistics, 2025). Identical education length is part of why the medians land within $610 of each other rather than thousands apart.
Demand volume favours electricians, breadth of work favours neither cleanly. Electricians held about 821,000 jobs in 2025 against 510,600 for plumbers, pipefitters and steamfitters, with 72,700 projected annual openings versus 42,000, and 9 percent projected growth from 2025 to 2035 against 7 percent (U.S. Bureau of Labor Statistics, 2025). A bigger, faster-growing occupation produces more competition for workers in tight markets — but it also produces more entry-level hiring, which drags the lower percentiles down. That tension helps explain why electricians lead at the 90th percentile by $90 while trailing at the 10th by $1,510.
Industry mix is the biggest single lever. Government employers, excluding state and local education and hospitals, paid electricians a median of $79,820 a year and plumbers $71,660 in May 2025 — $16,630 and $7,860 above each trade's own overall median respectively. Public-sector and institutional work pays both trades well above their all-industry medians, and it rewards electricians more. If the $8,160 government gap matters to you, the practical move is to compare public-sector postings in your state against private residential and commercial work before you commit to a trade.
Frequently asked questions
Which trade pays more at the start?
Plumbers, pipefitters and steamfitters. The lowest-paid 10 percent of plumbers earned under $44,150 a year in May 2025, compared with under $42,640 for the lowest-paid 10 percent of electricians (U.S. Bureau of Labor Statistics, 2025-05) — a $1,510 annual edge for plumbers at the bottom of the scale.
Which trade has the higher ceiling?
Electricians, by a margin so small it is practically a tie. The top 10 percent of electricians earned more than $108,510 a year in May 2025 against more than $108,420 for plumbers, pipefitters and steamfitters (U.S. Bureau of Labor Statistics, 2025-05) — $90 a year apart. At that level, how much overtime you work will move your take-home far more than which trade you chose.
If I want government or public-sector work, which should I pick?
Electricians. Within government employment excluding state and local education and hospitals, the median annual wage for electricians was $79,820 in May 2025 versus $71,660 for plumbers, pipefitters and steamfitters (U.S. Bureau of Labor Statistics, 2025-05), a gap of $8,160 a year — the widest of any comparison in this guide.
Does one trade have more job openings?
Electricians, clearly. BLS projects about 72,700 openings a year for electricians over 2025–2035 against about 42,000 for plumbers, pipefitters and steamfitters (U.S. Bureau of Labor Statistics, 2025), with projected growth of 9 percent for electricians versus 7 percent for plumbers. More openings is a volume signal, not a pay signal — electricians' median annual wage of $63,190 still sits $610 below plumbers' $63,800 (May 2025).
Sources
- U.S. Bureau of Labor Statistics — Electricians : Occupational Outlook Handbook (2025-05)
- U.S. Bureau of Labor Statistics — Plumbers, Pipefitters, and Steamfitters : Occupational Outlook Handbook (2025-05)

Written by
Harlan Voss
Harlan covers the business of job-seeking itself — the coaches, platforms, and advice industries that have grown up around finding work. He writes with a skeptic's patience and a soft spot for anyone still trying.